
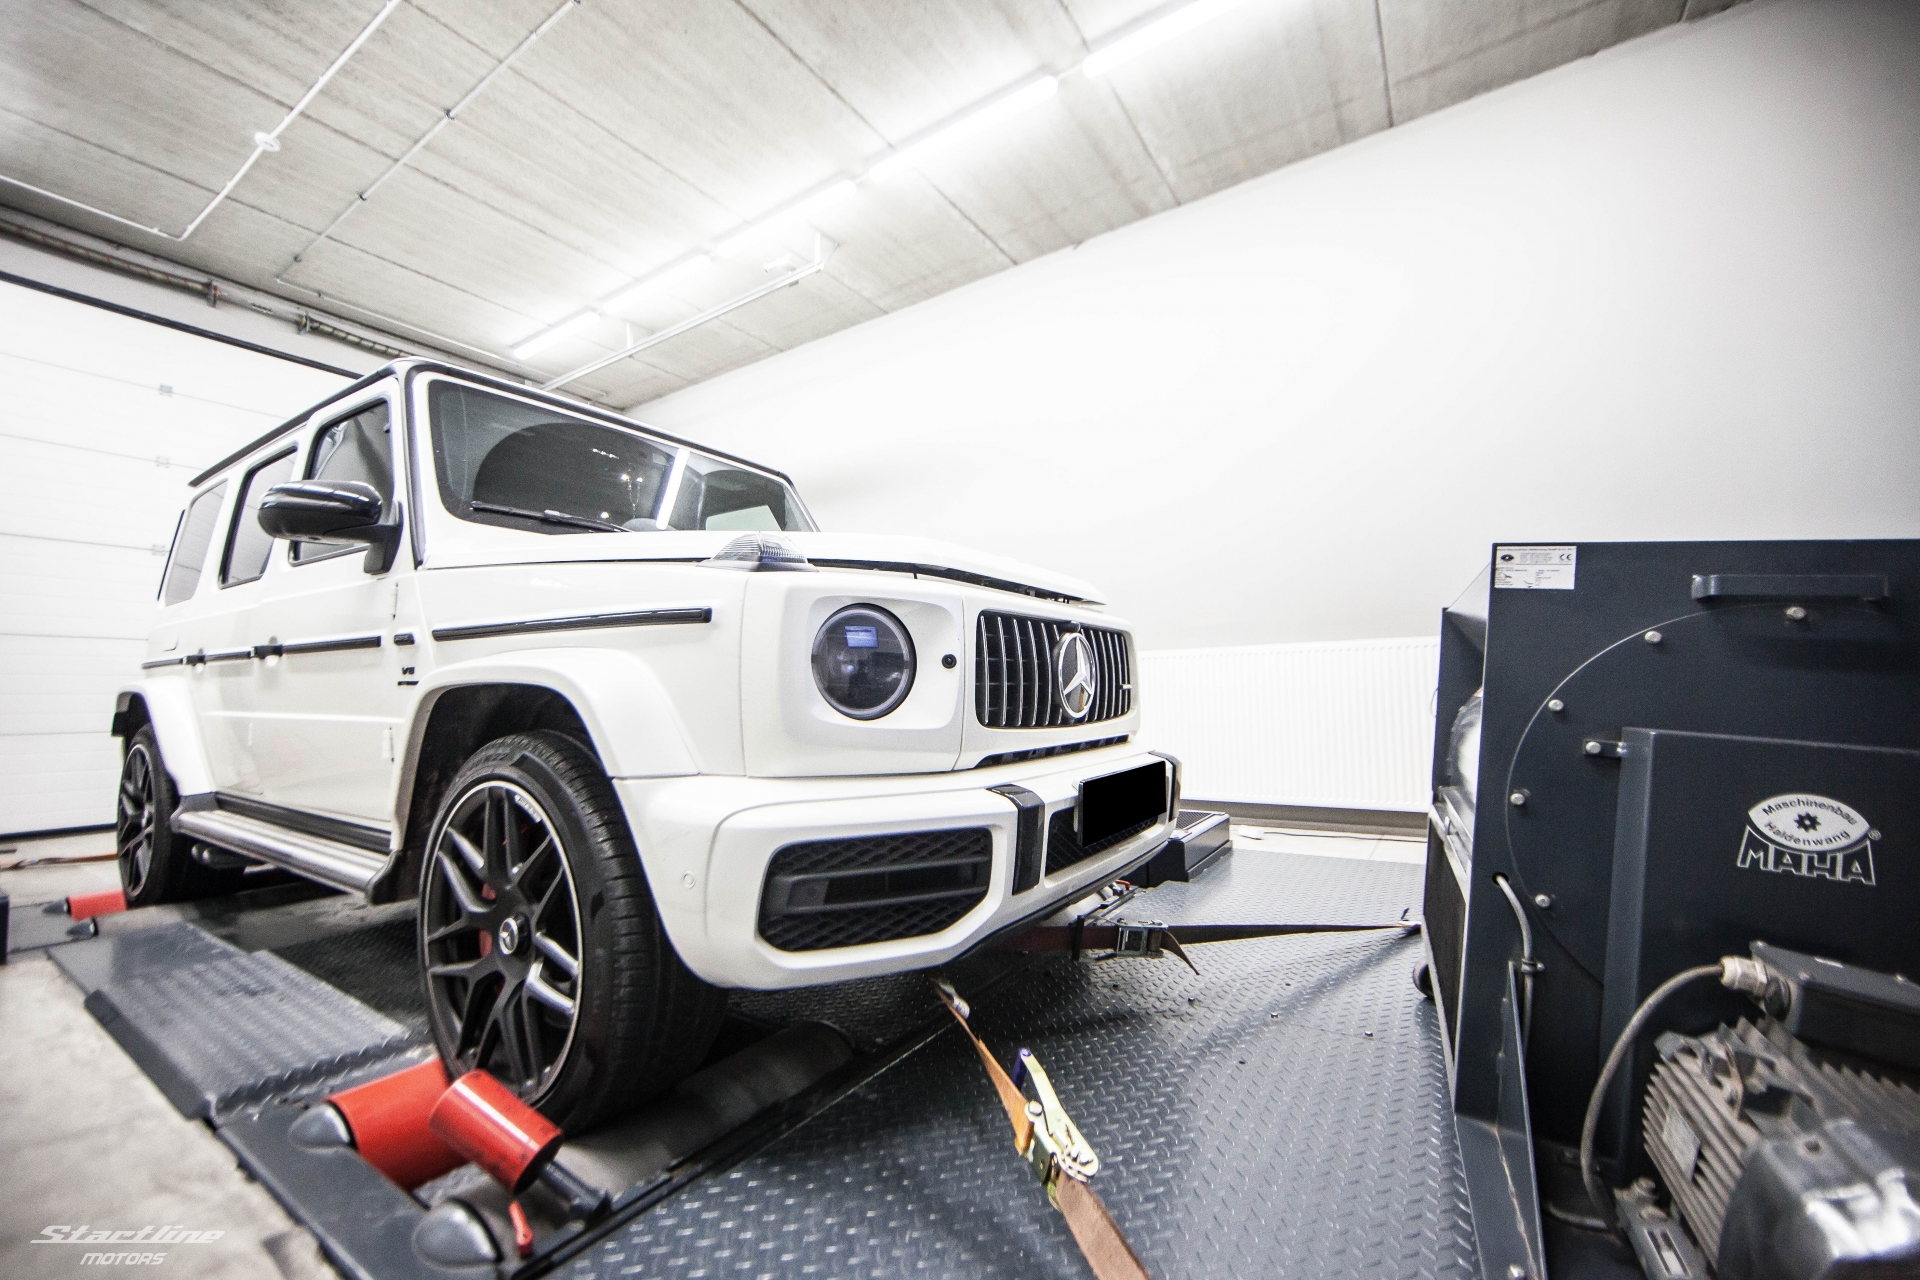
More than peak power
Dyno testing shows power and torque across the measured rpm range. We assess smoothness, high-rpm delivery and changes before and after work, not just peaks. Our two different dyno types let us select equipment for the car and test purpose.
MAHA LPS 3000 — everyday vehicles
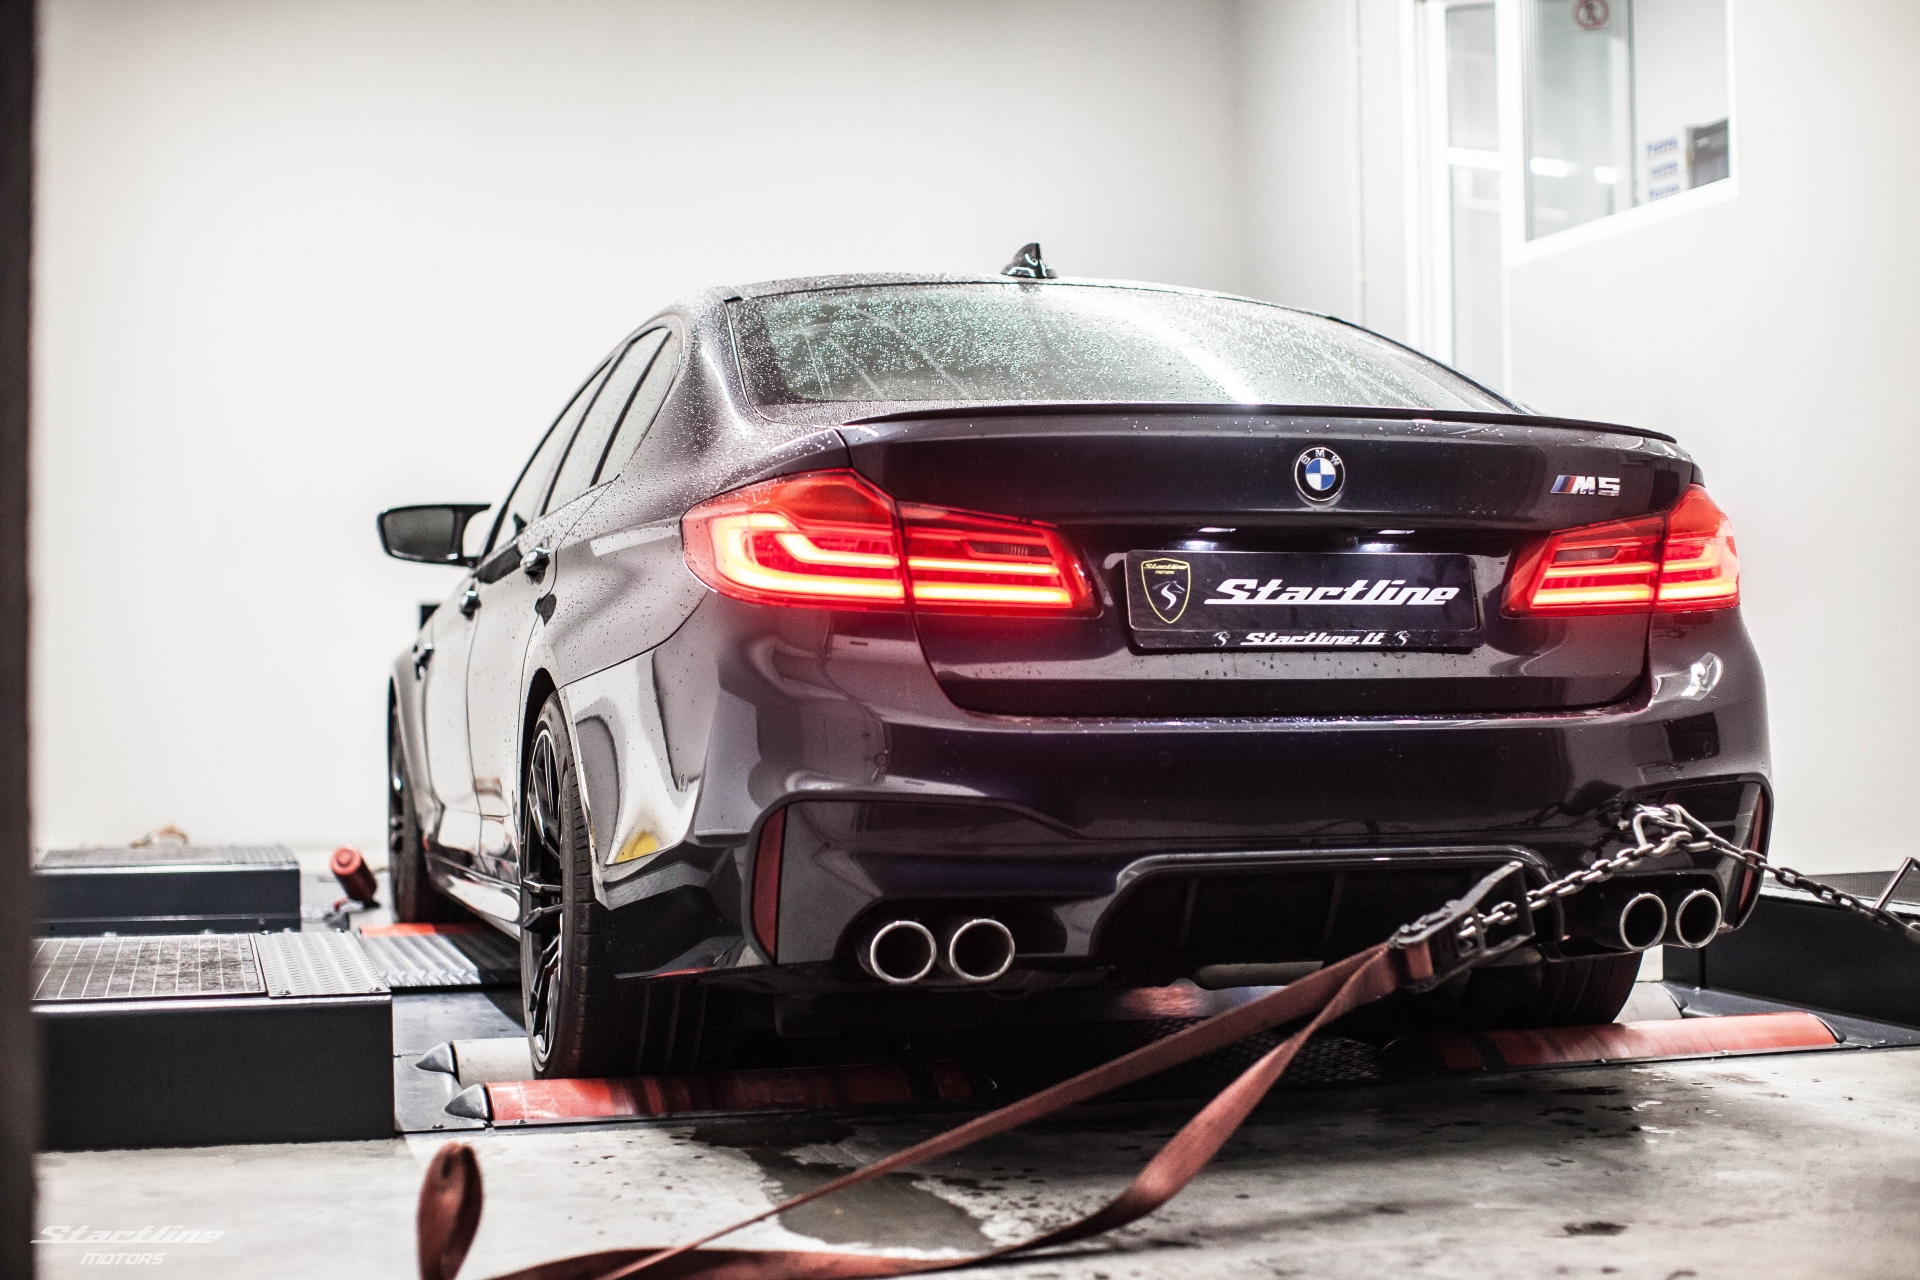
We use the MAHA LPS 3000 roller dyno to assess everyday cars and verify tuning results. The wheels drive the rollers. Controlled load supports both power sweeps and checks under selected operating conditions.
MAHA separates wheel power from losses estimated during coast-down to calculate engine power. This is not a direct crankshaft measurement. Tyres, pressures, temperature and roller contact affect wheel output, so the test sheet must be interpreted correctly.
Before-and-after tests on the same dyno show changes in torque, power and curve smoothness. A graph alone does not replace diagnosis or guarantee overall engine condition.
Mainline ProHub 2000 — high-output builds
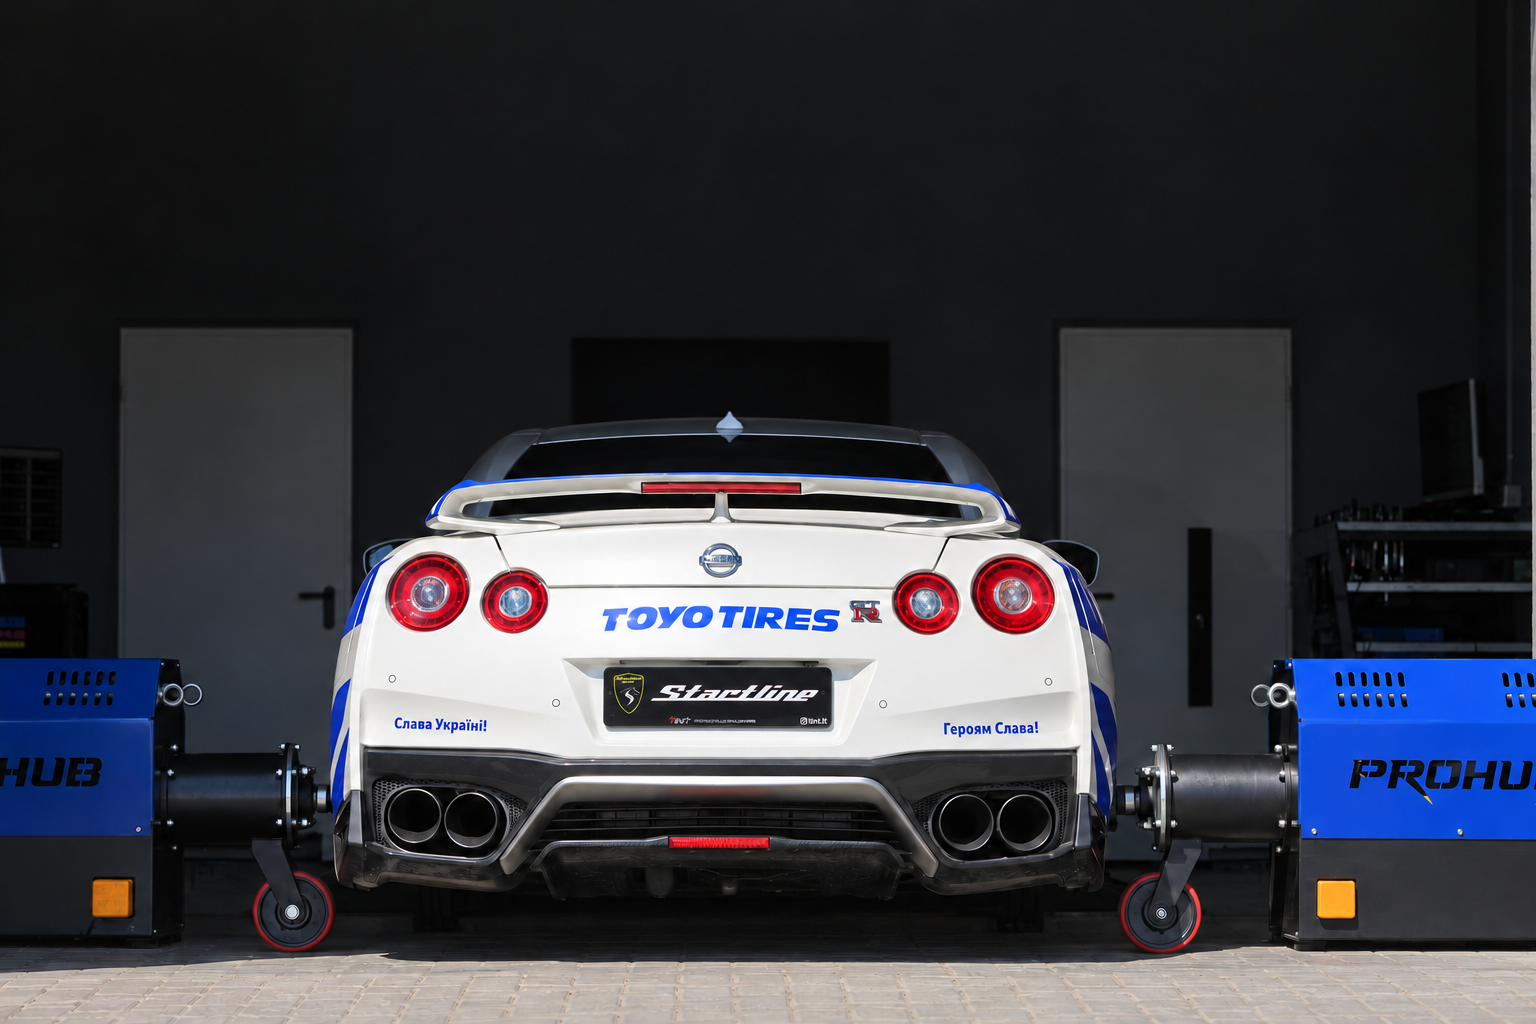
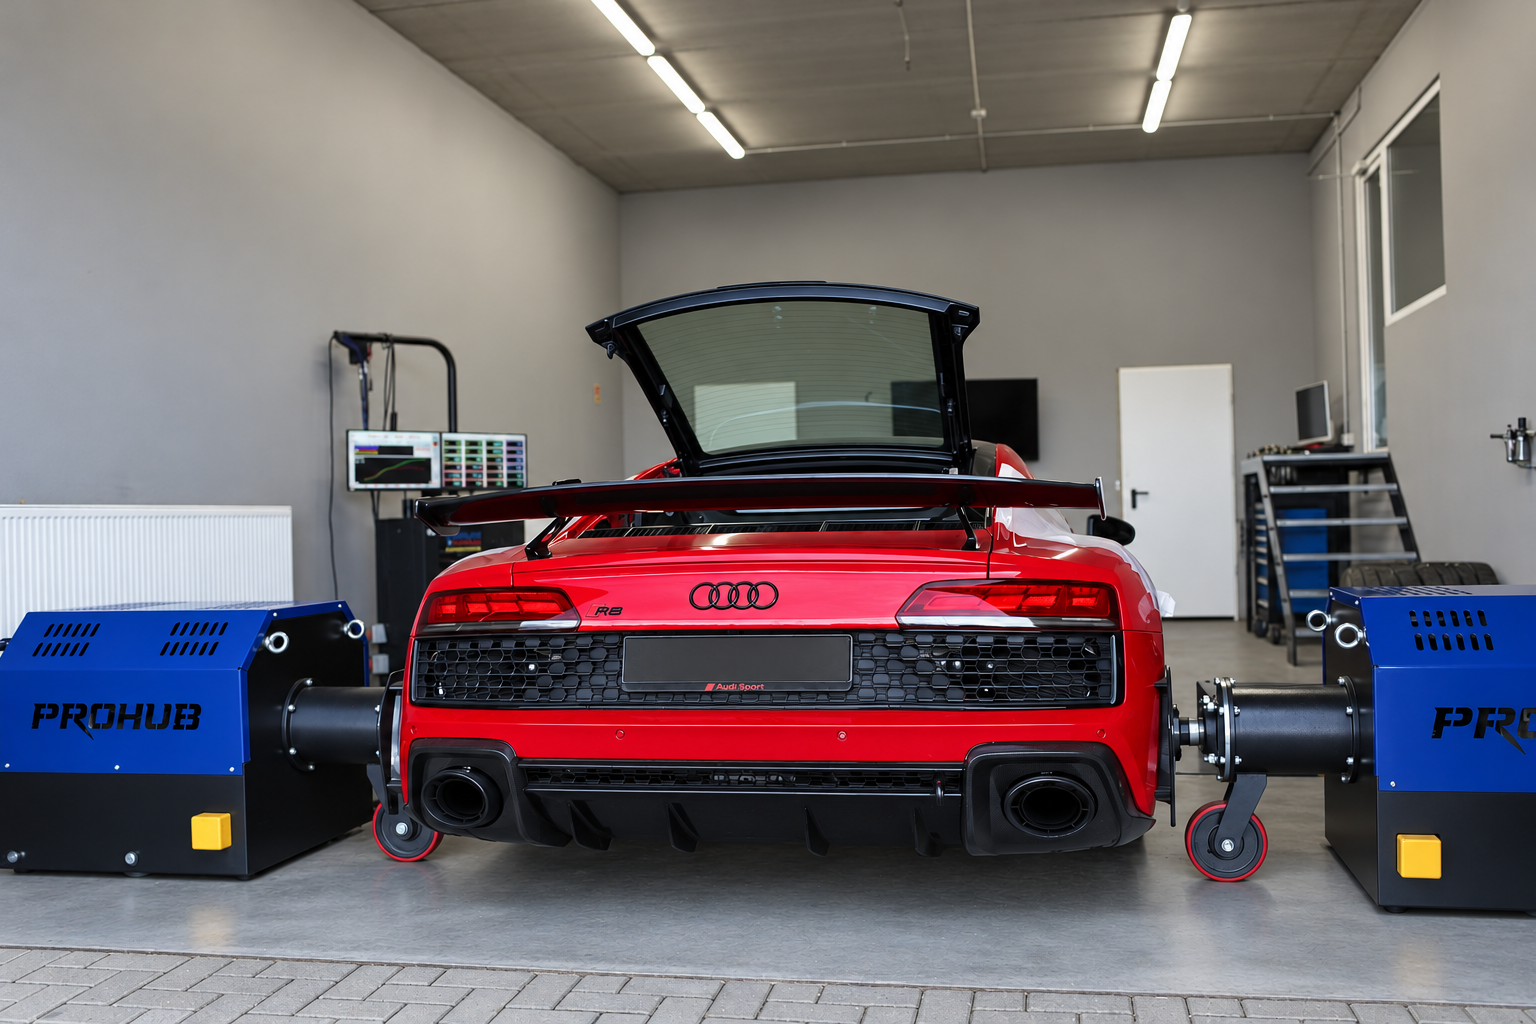
We use Mainline ProHub 2000 for high-output and custom competition builds. Adapters replace the driven wheels being measured and connect the modules directly to the hubs, removing dependence on tyre-to-roller grip.
This eliminates tyre slip, deformation and wheel acceleration effects, particularly useful when high output makes tyres a roller-dyno limitation. Controlled load and ramp rate allow repeatable calibration rather than reliance on one brief peak.
Mainline measures at the hubs, with the transmission still between engine and dyno. It is not automatically crankshaft power. Although not limited to powerful cars, we choose it where hub measurement benefits the project most.
Why can different dynos show different figures?
Roller power, hub power and calculated engine power are different quantities. Removing wheels changes test conditions. No universal percentage accurately converts between dyno types.
Compare changes on the same dyno, in the same gear and under similar conditions. Fuel, engine and intake temperatures, cooling, load and ramp rate matter, as do atmospheric correction and the correction standard used.
| Palyginimas | MAHA LPS 3000 | Mainline ProHub 2000 |
|---|---|---|
| How is the car connected? | The wheels drive the rollers. | Adapters connect to the hubs; the measured wheels are removed. |
| Tyre influence | Grip, deformation, pressure and temperature affect results. | Tyres and wheels are excluded from the measurement. |
| Where is power measured? | At the rollers; engine power is calculated using estimated losses. | At the hubs; not directly at the crankshaft. |
| Our typical use | Everyday cars and verifying tuning gains. | High-output and custom-calibrated builds. |
Preparing for testing and discussing results
We discuss modifications, fuel and the test goal first. The car must be fit for load testing: oil, cooling, sealing, transmission and, for roller tests, tyres all matter. Unusual noise, overheating and active faults require assessment before maximum-load testing.
The car is secured or connected to the modules, with cooling and operating temperatures established. Test mode is selected for the engine, transmission and dyno. Repeat runs also assess stability as temperatures change.
We discuss power and torque curves and rpm rather than only peaks, overlaying before-and-after runs where available. A modelled curve in the vehicle database is an indicative illustration, not your car’s dyno measurement; a test establishes its actual result.
On our dyno
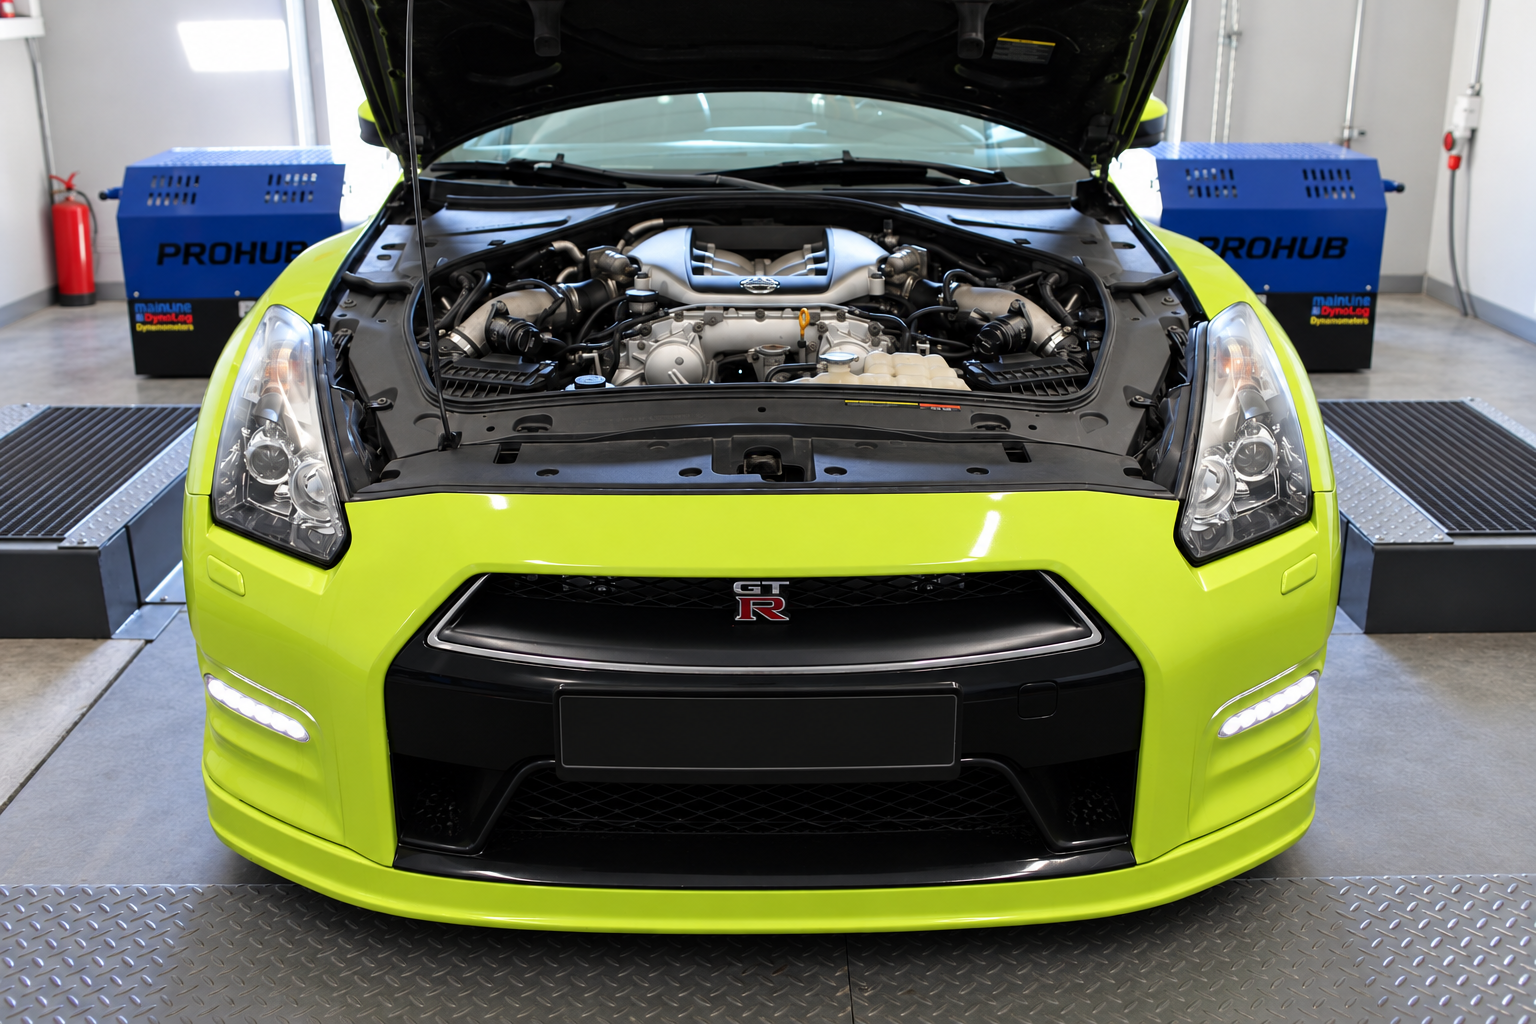
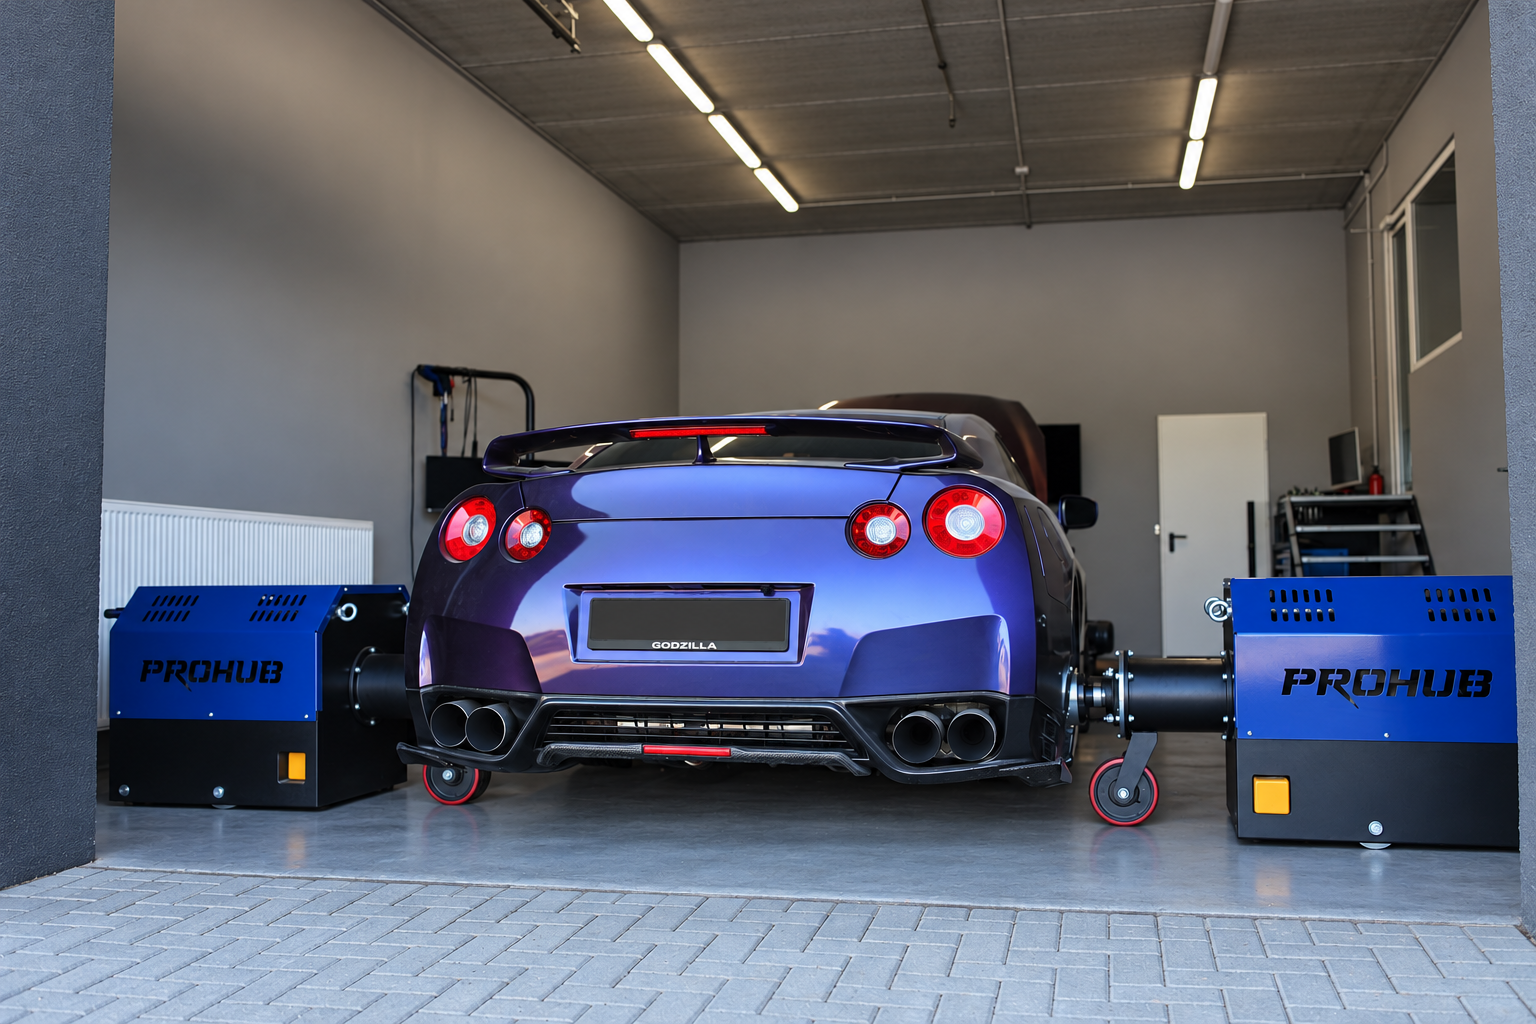
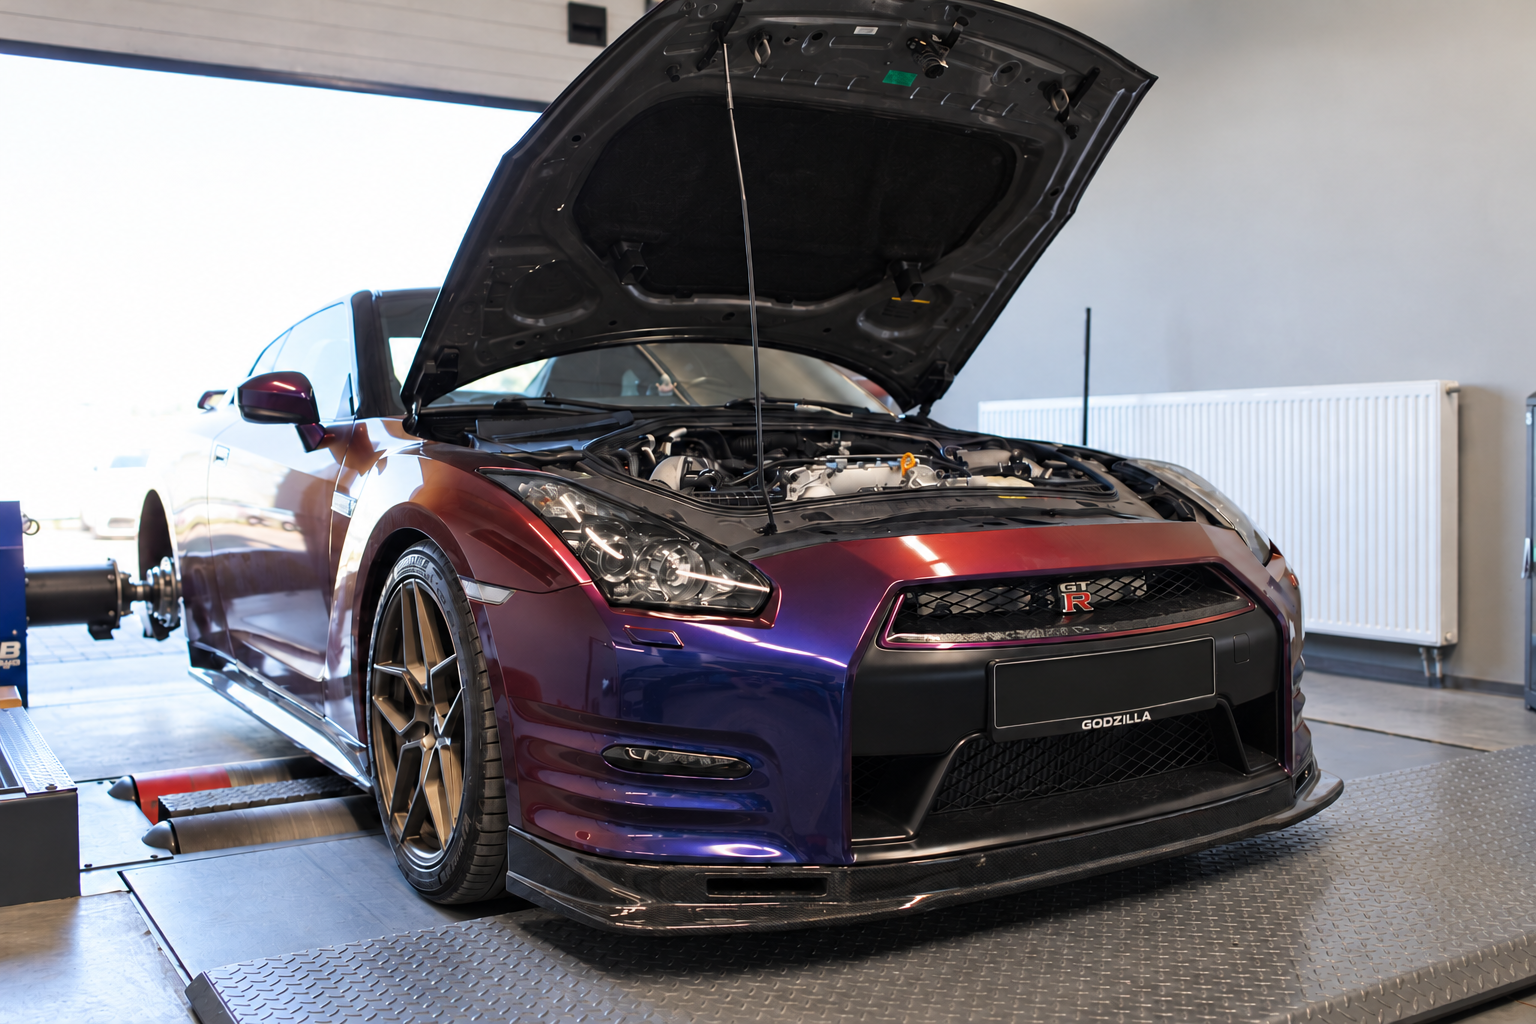
- Dyno and test-mode selection for the car
- Power and torque curves against engine speed
- Explanation of test conditions and the reported power measurement
- Before-and-after comparison where both tests are performed